R & ggplot2: IEL 2025 Statistics
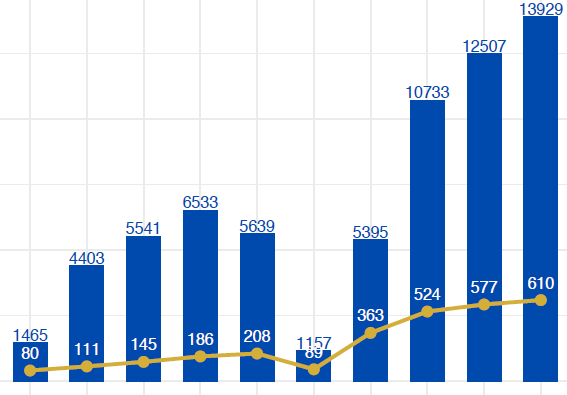
This report for the International English Library was generated in R using various data analysis and plotting packages such as ggplot2. It analyzes the total item checkouts and distinct patron statistics for 2025, and for historical checkout data, illustrating the library's growth in the past 4 years. The report was generated with R Markdown and tinytex.